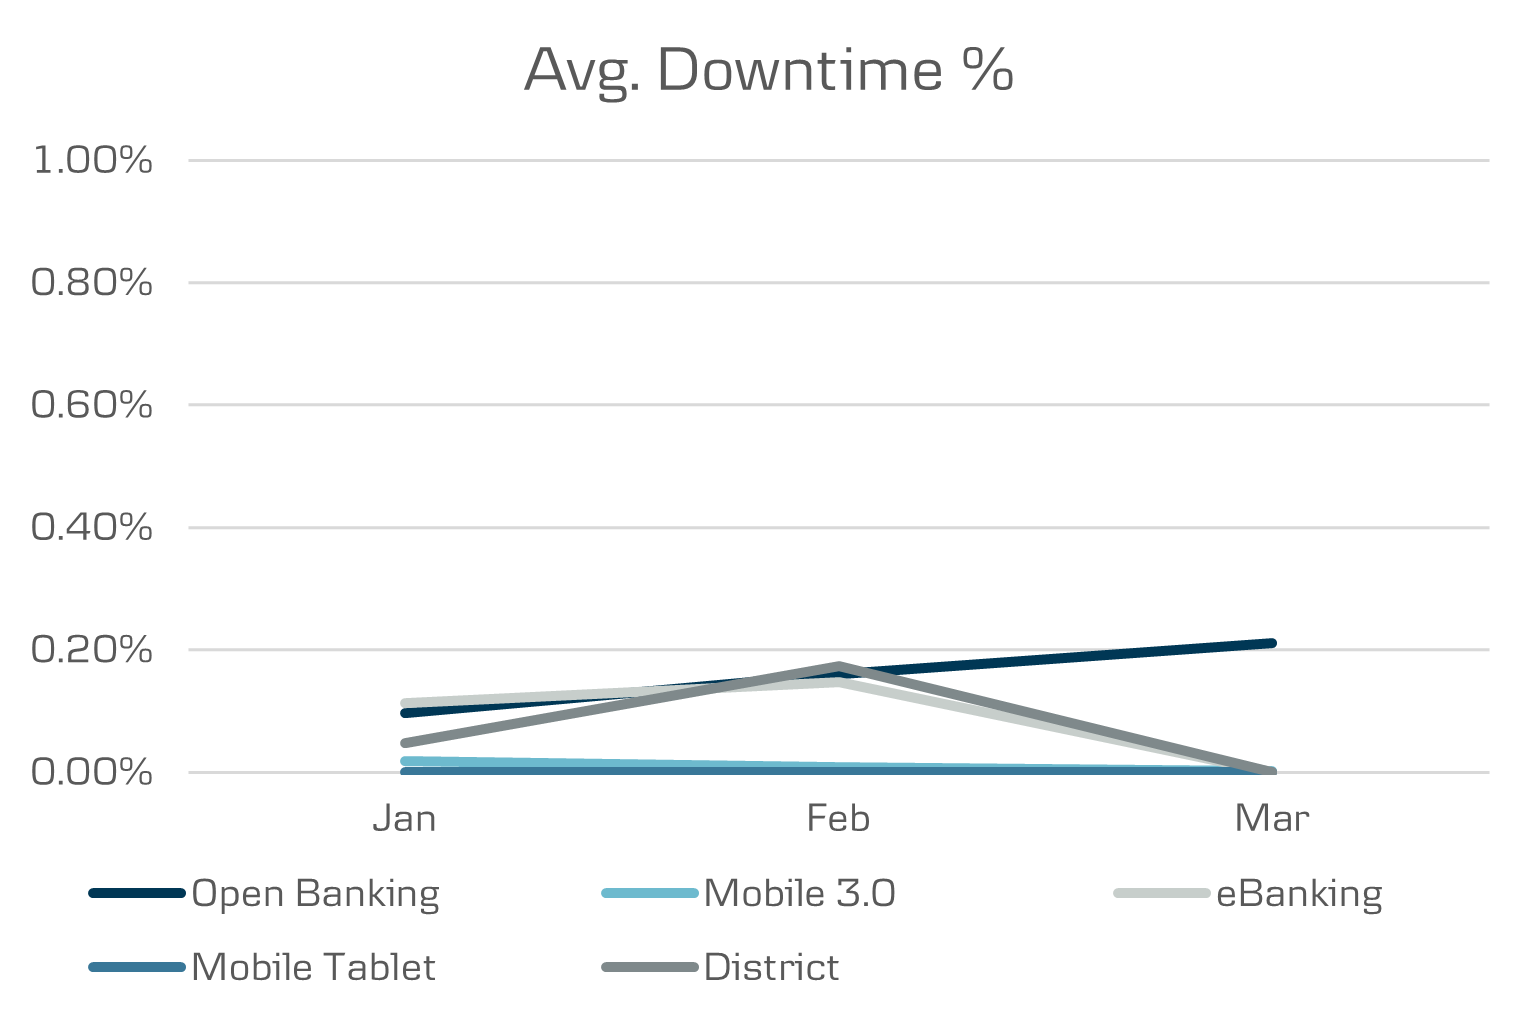
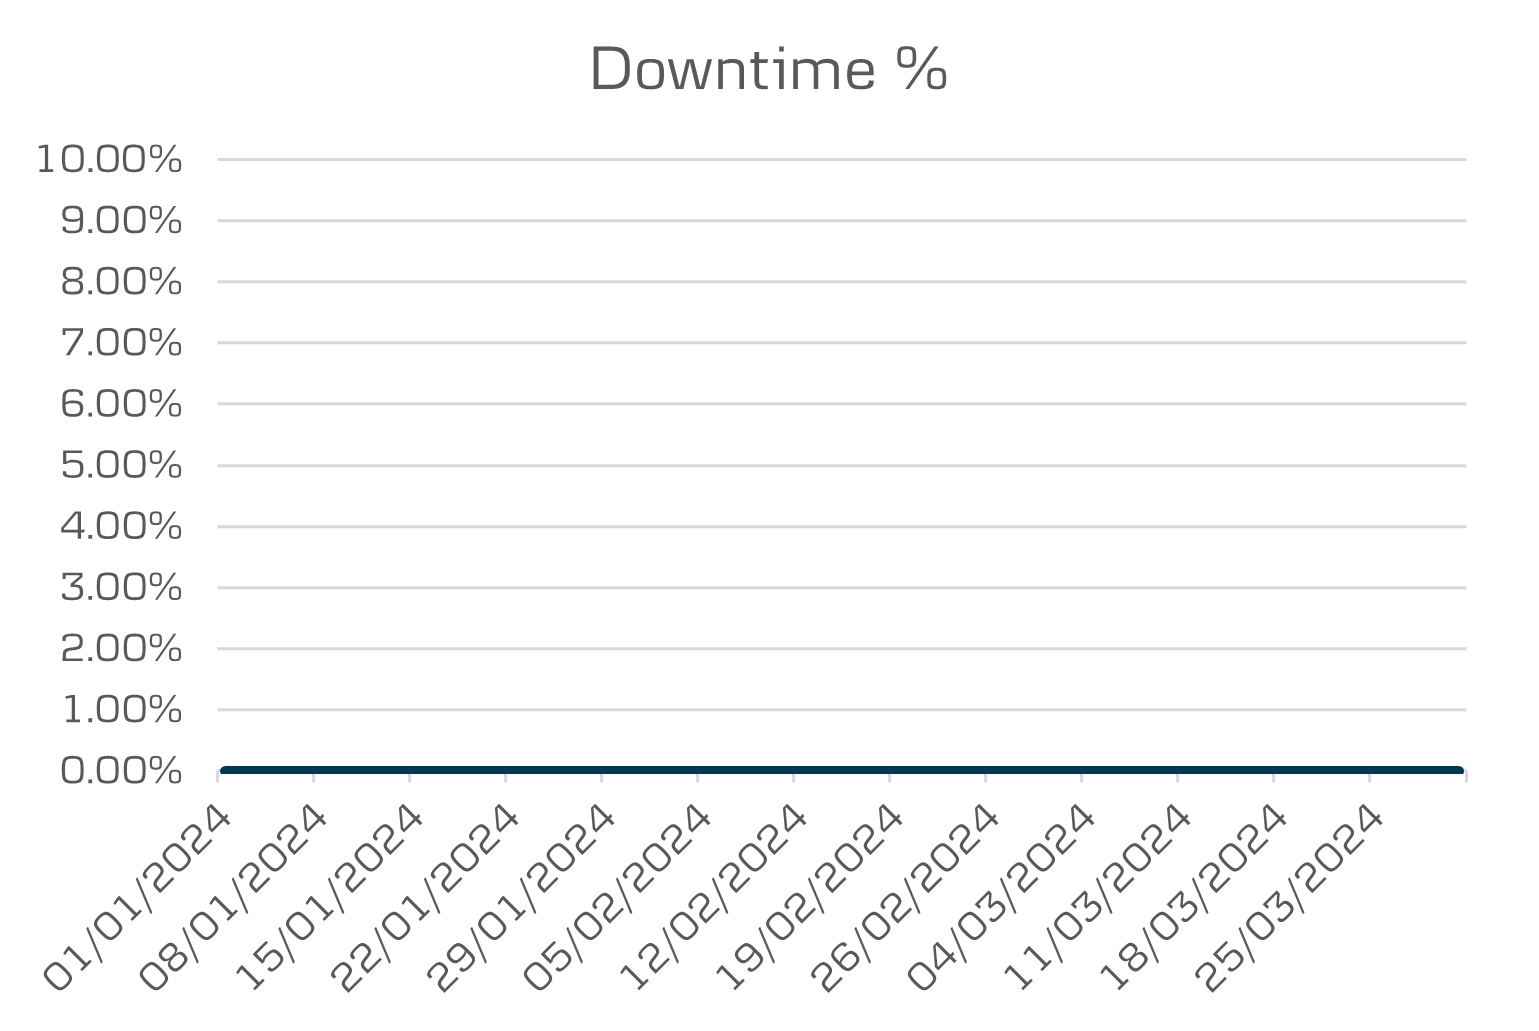
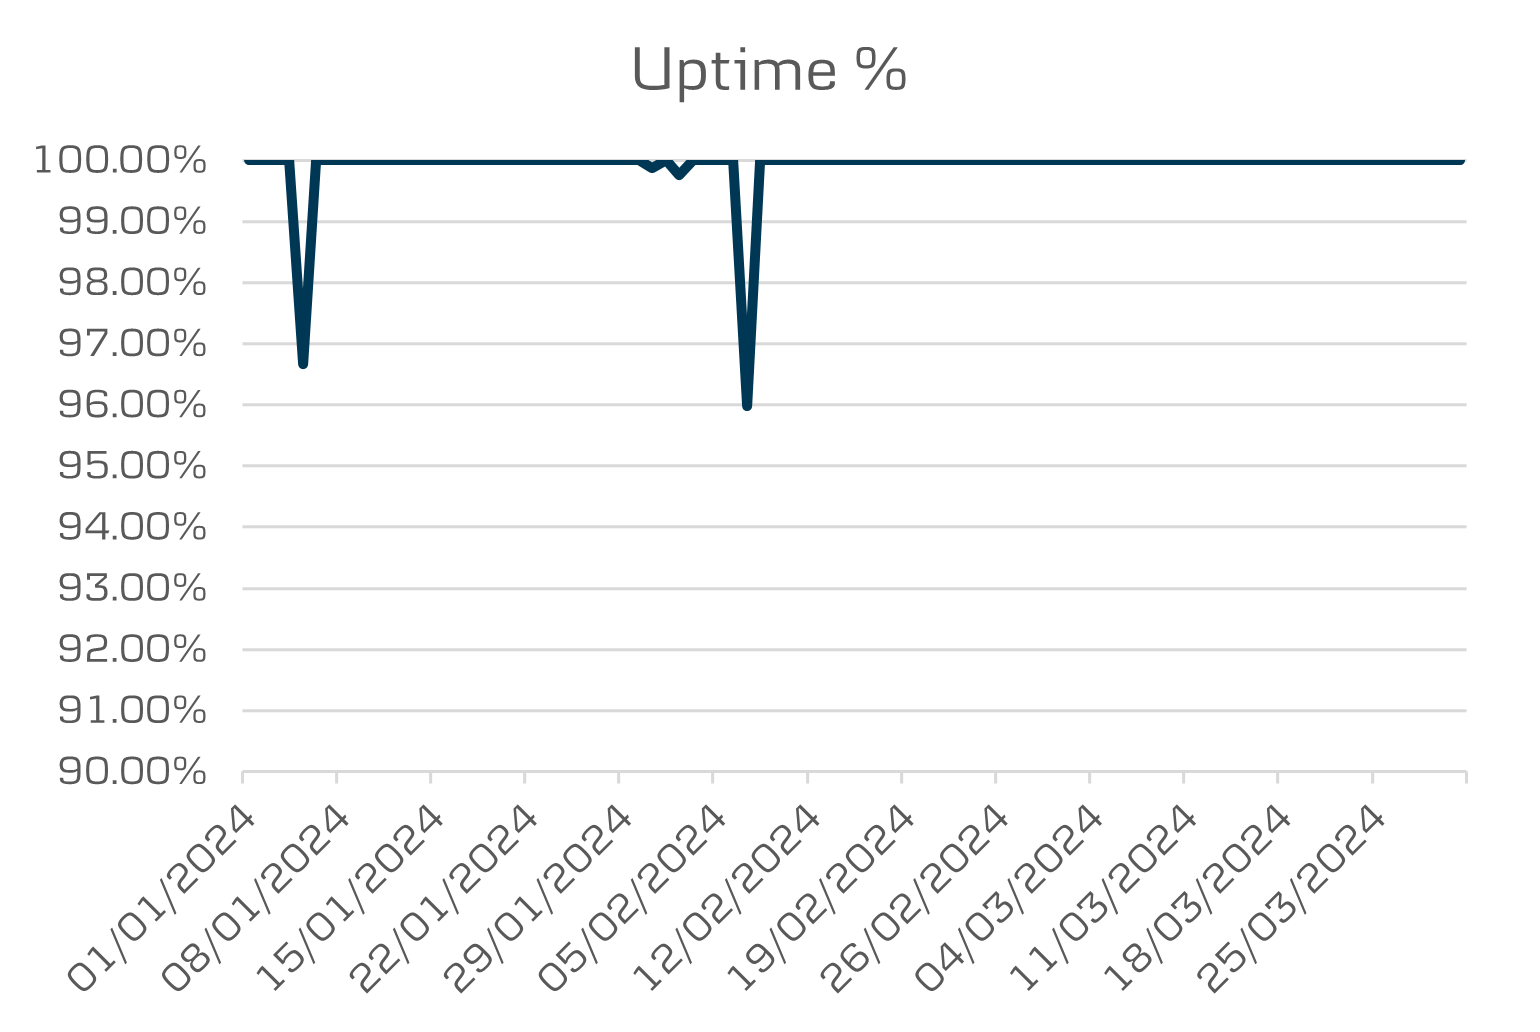
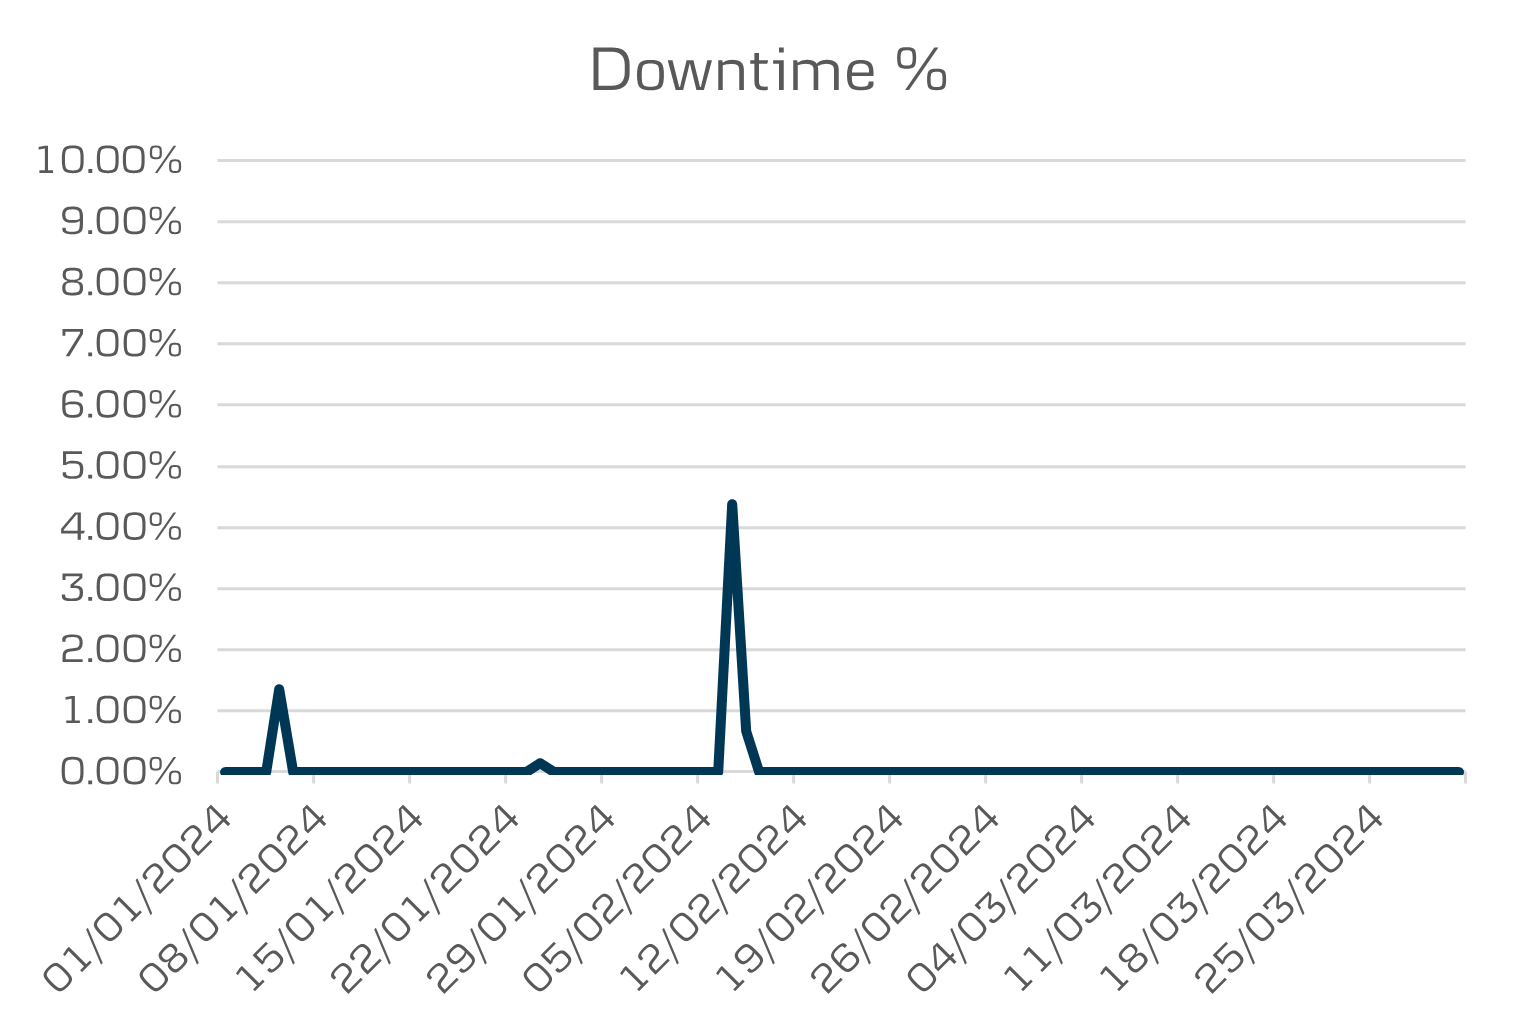
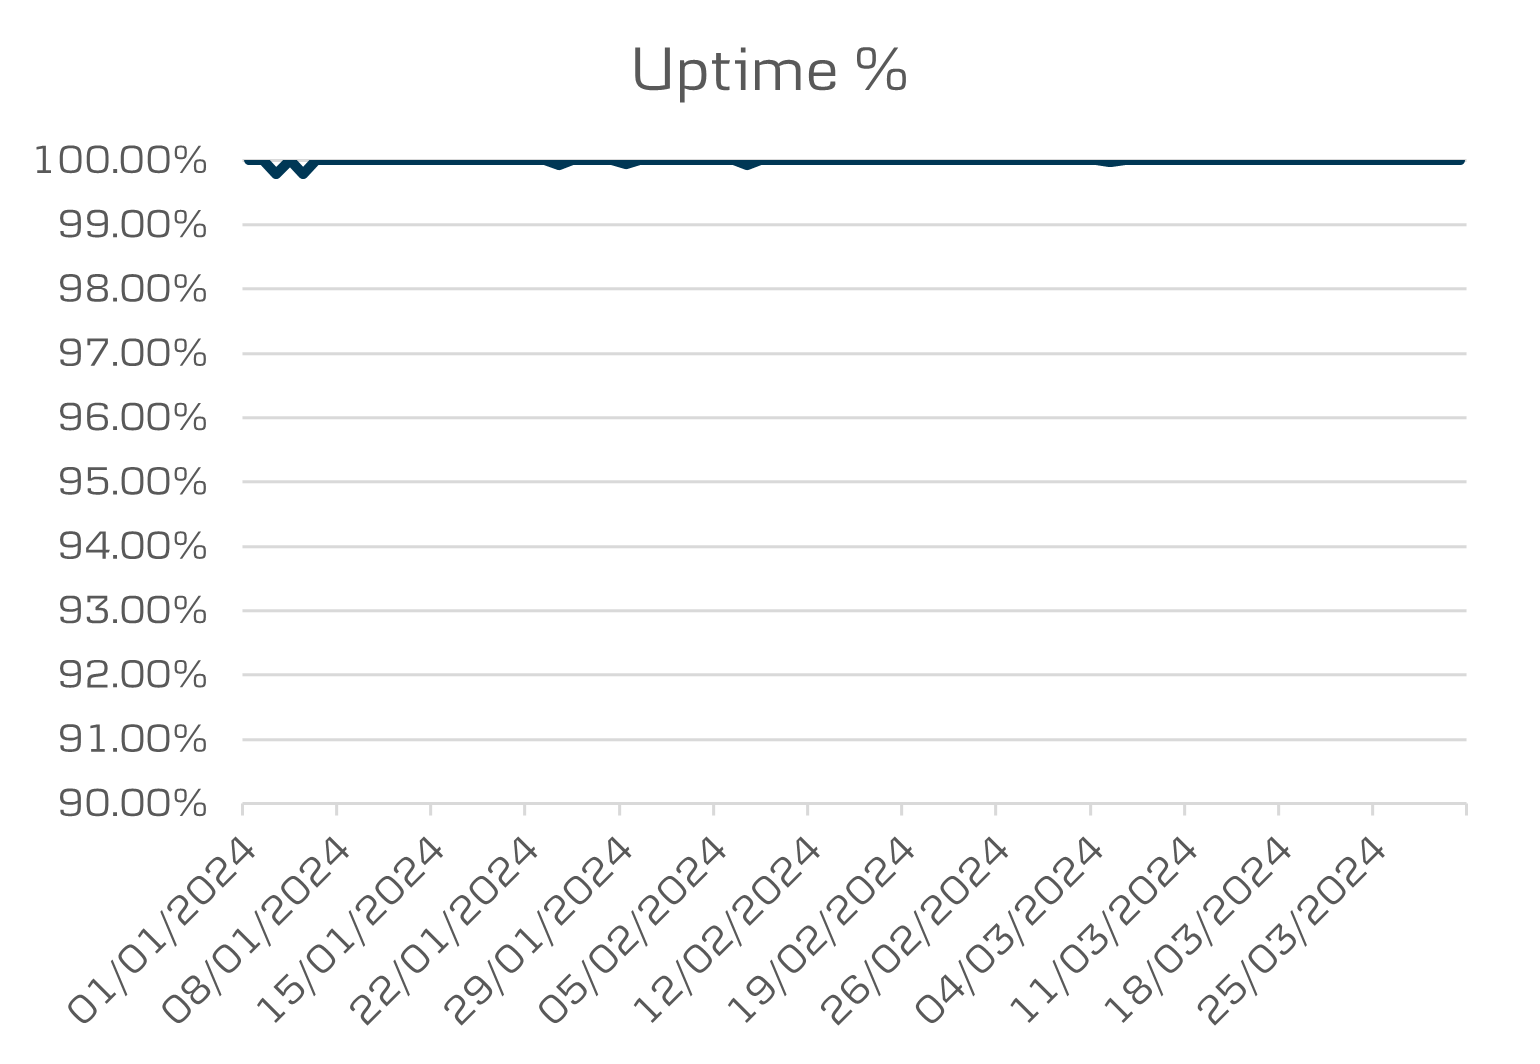
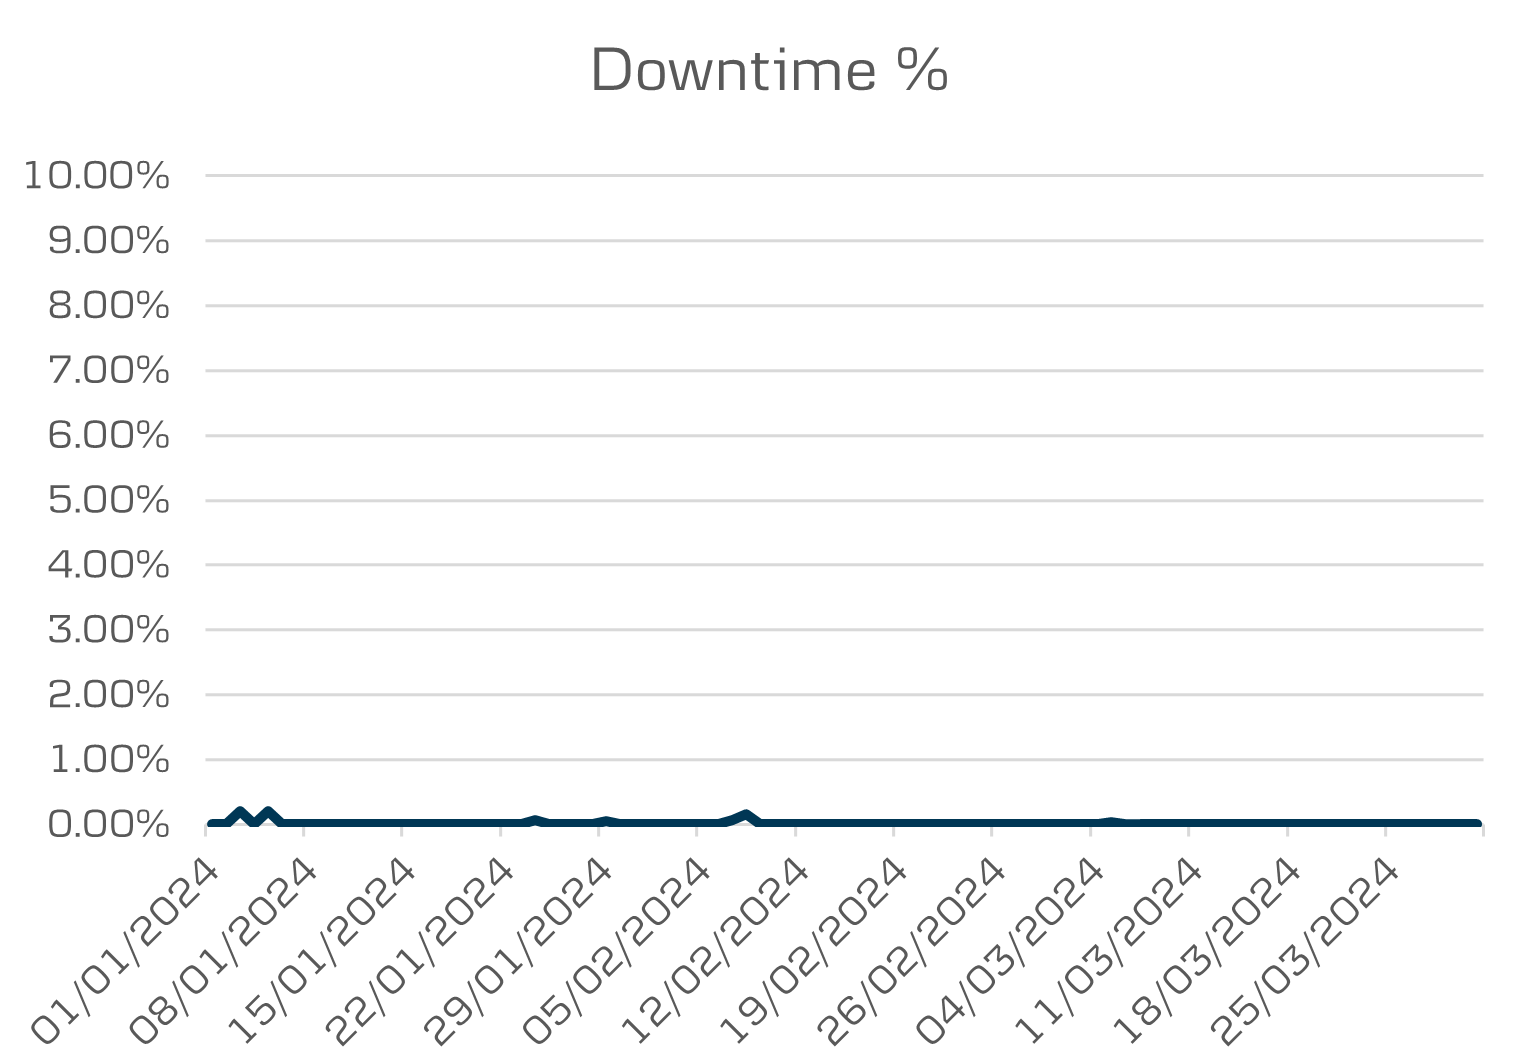
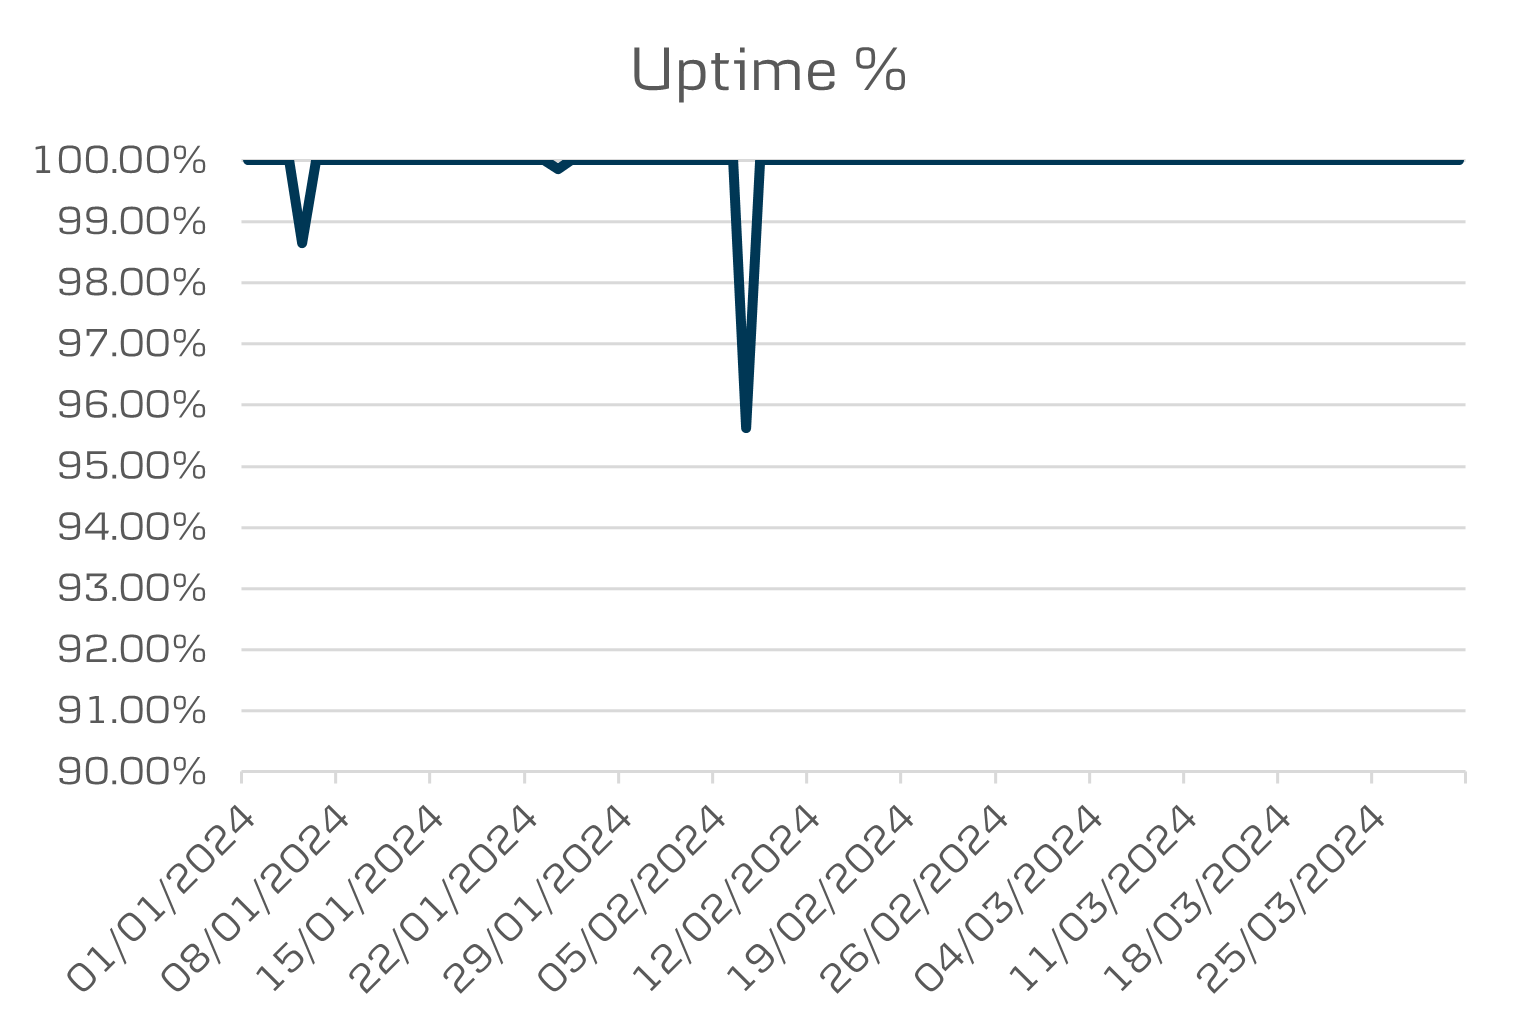
Comparison Data – All Channels
The below charts shows the availability performance for all online channels for Quarter 1 2024
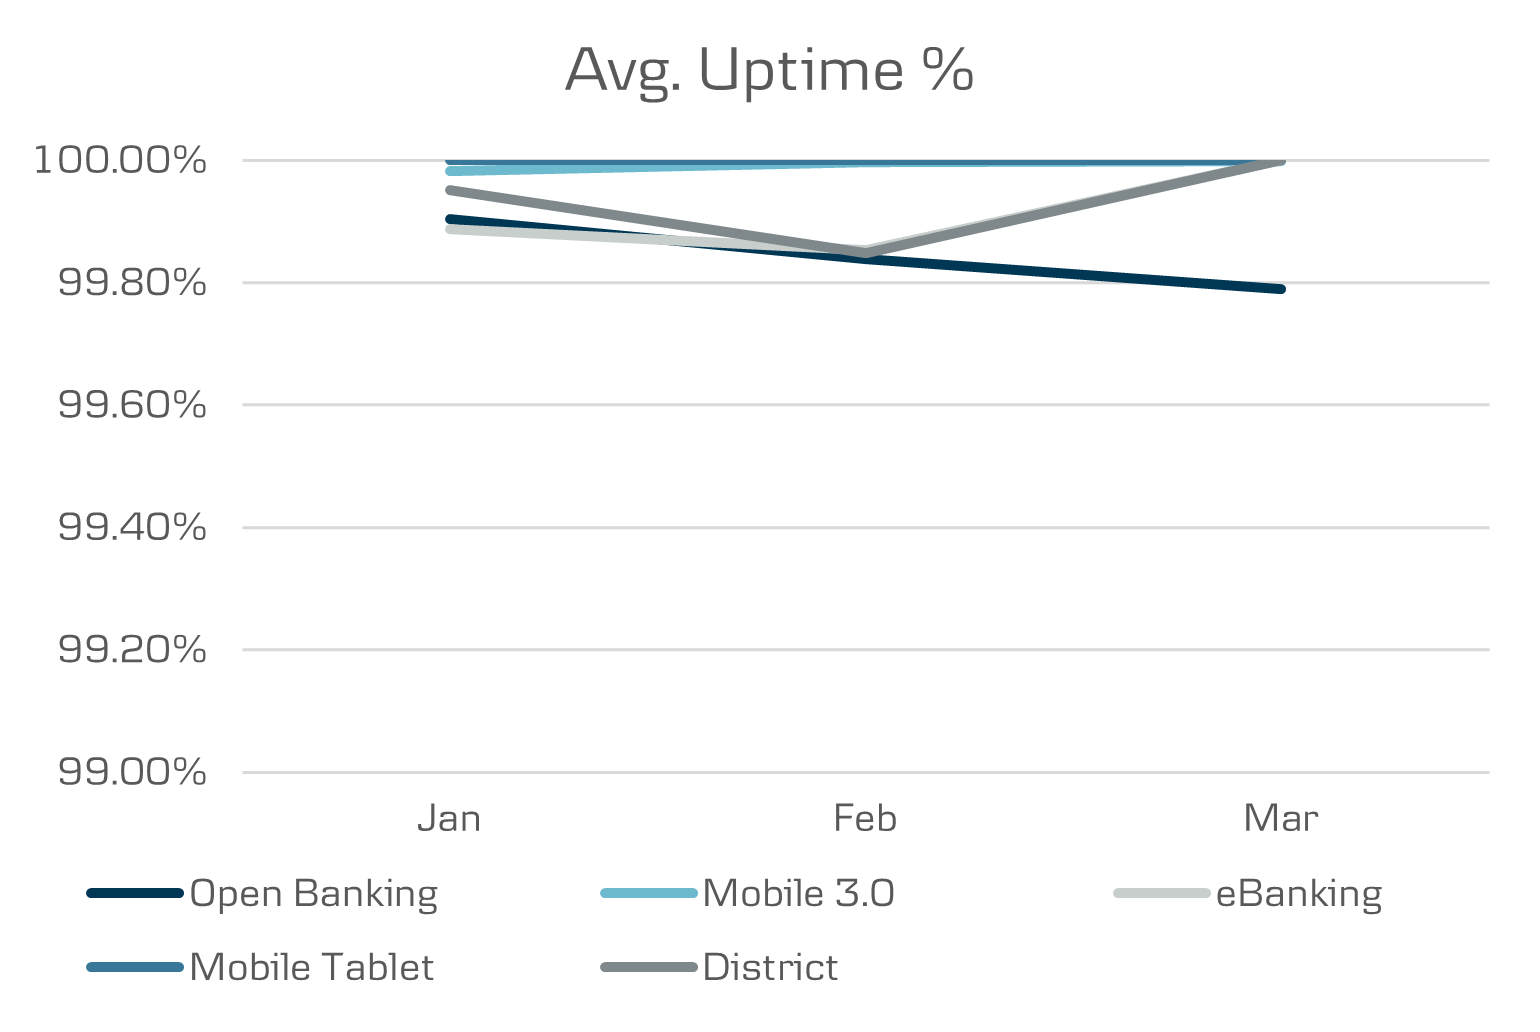
| Uptime | Open Banking | Mobile 3.0 | Mobile Tablet | eBanking | District |
|---|---|---|---|---|---|
| Jan | 99.90 | 99.98 | 100.00 | 99.89 | 99.95 |
| Feb | 99.84 | 100.00 | 100.00 | 99.85 | 99.85 |
| Mar | 99.79 | 100.00 | 100.00 | 100.00 | 100.00 |
| Total | 99.84 | 99.99 | 100.00 | 99.91 | 99.93 |
| Downtime | Open Banking | Mobile 3.0 | Mobile Tablet | eBanking | District |
|---|---|---|---|---|---|
| Jan | 0.10 | 0.02 | 0.00 | 0.11 | 0.05 |
| Feb | 0.16 | 0.01 | 0.00 | 0.15 | 0.17 |
| Mar | 0.21 | 0.00 | 0.00 | 0.00 | 0.00 |
| Total | 0.16 | 0.01 | 0.00 | 0.09 | 0.07 |
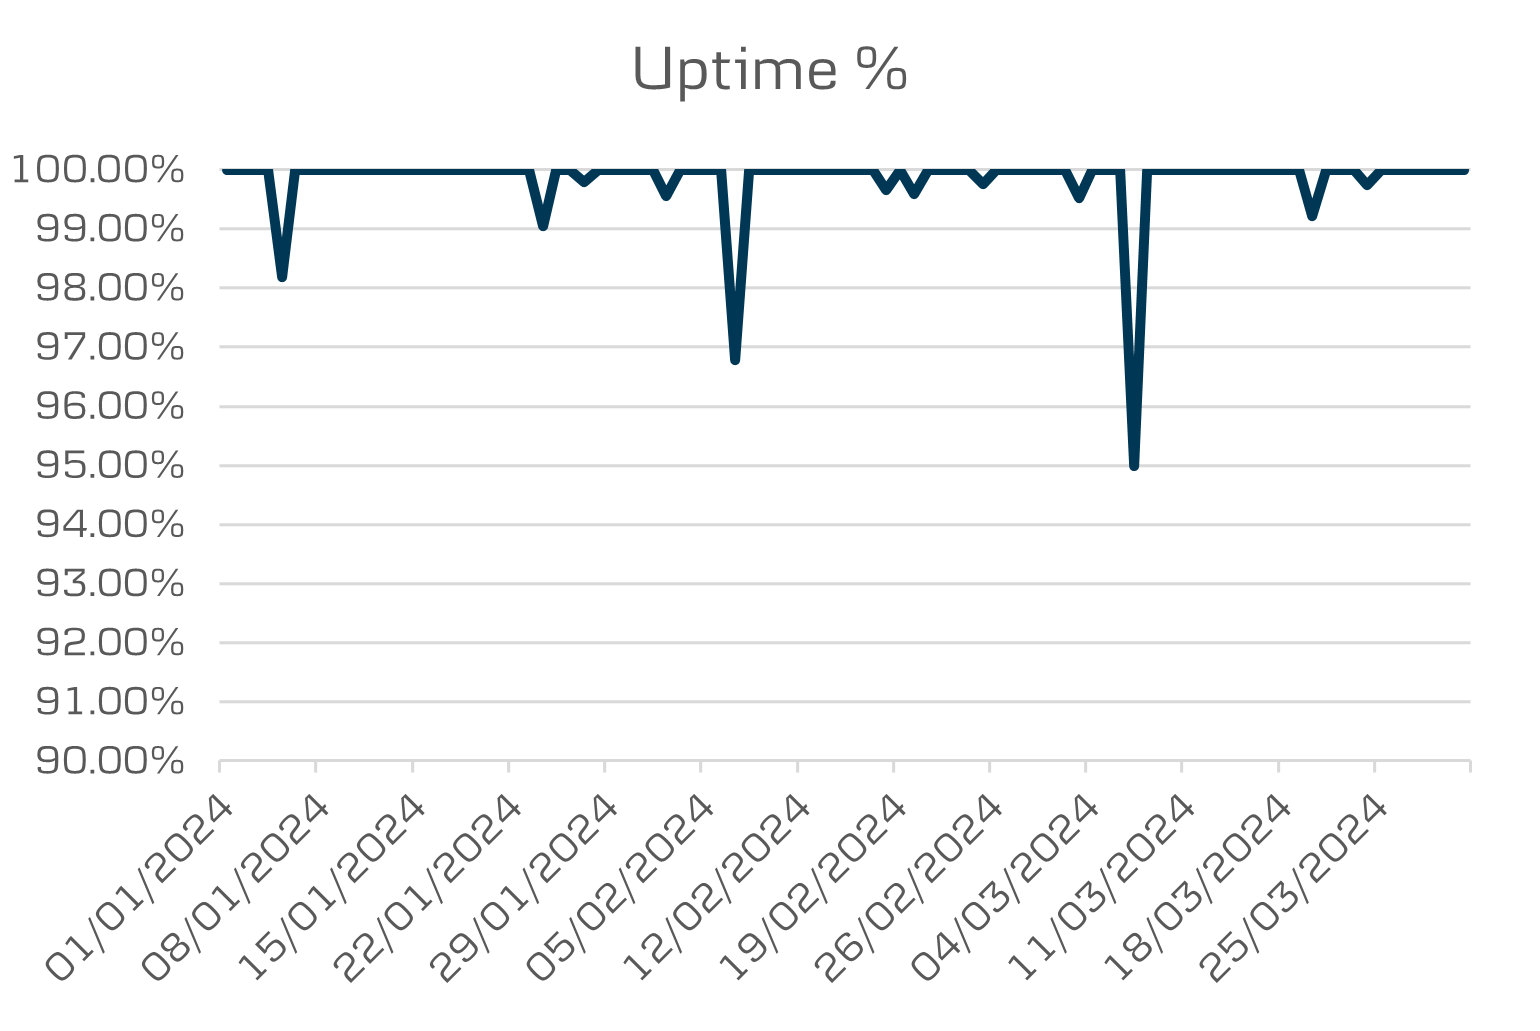
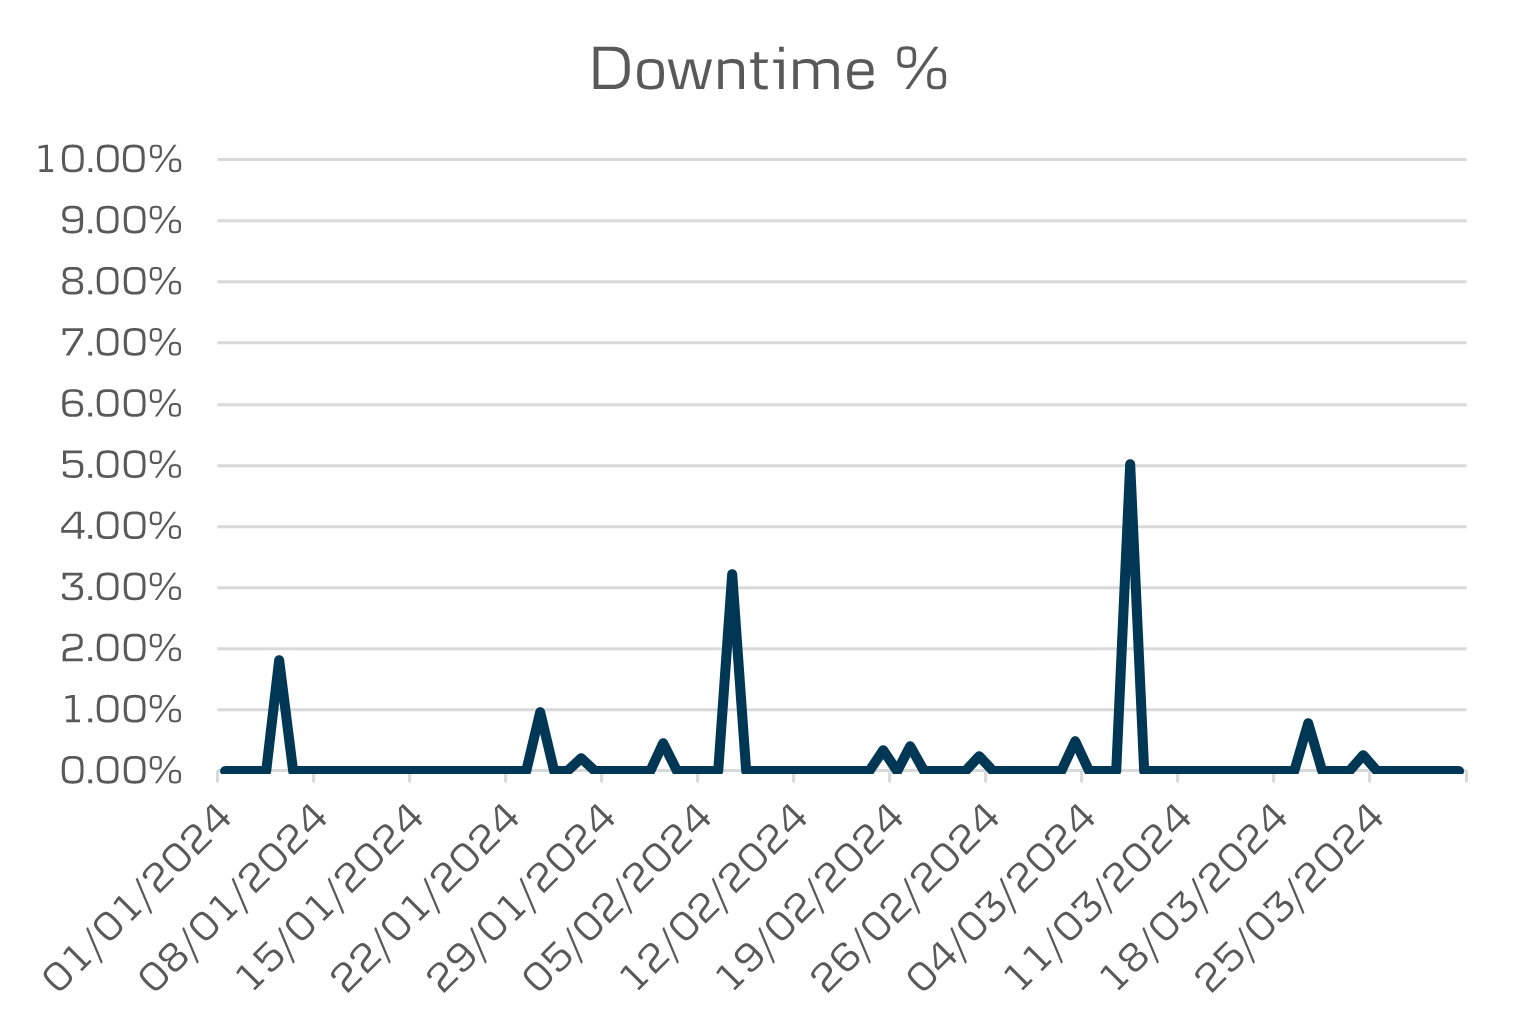
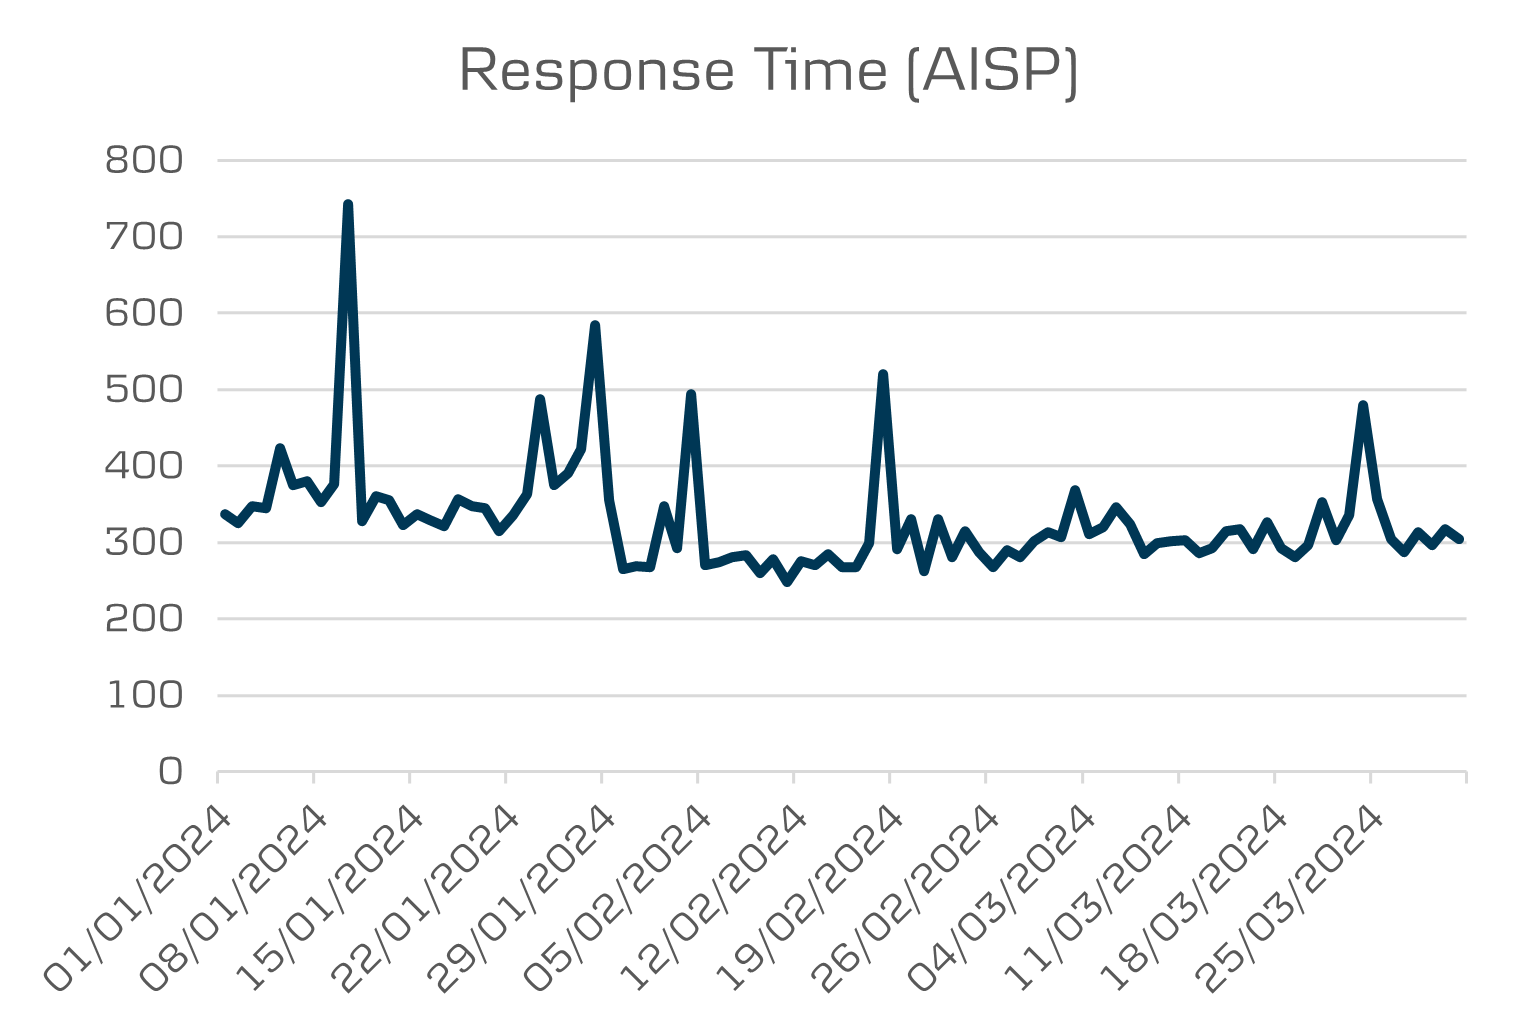
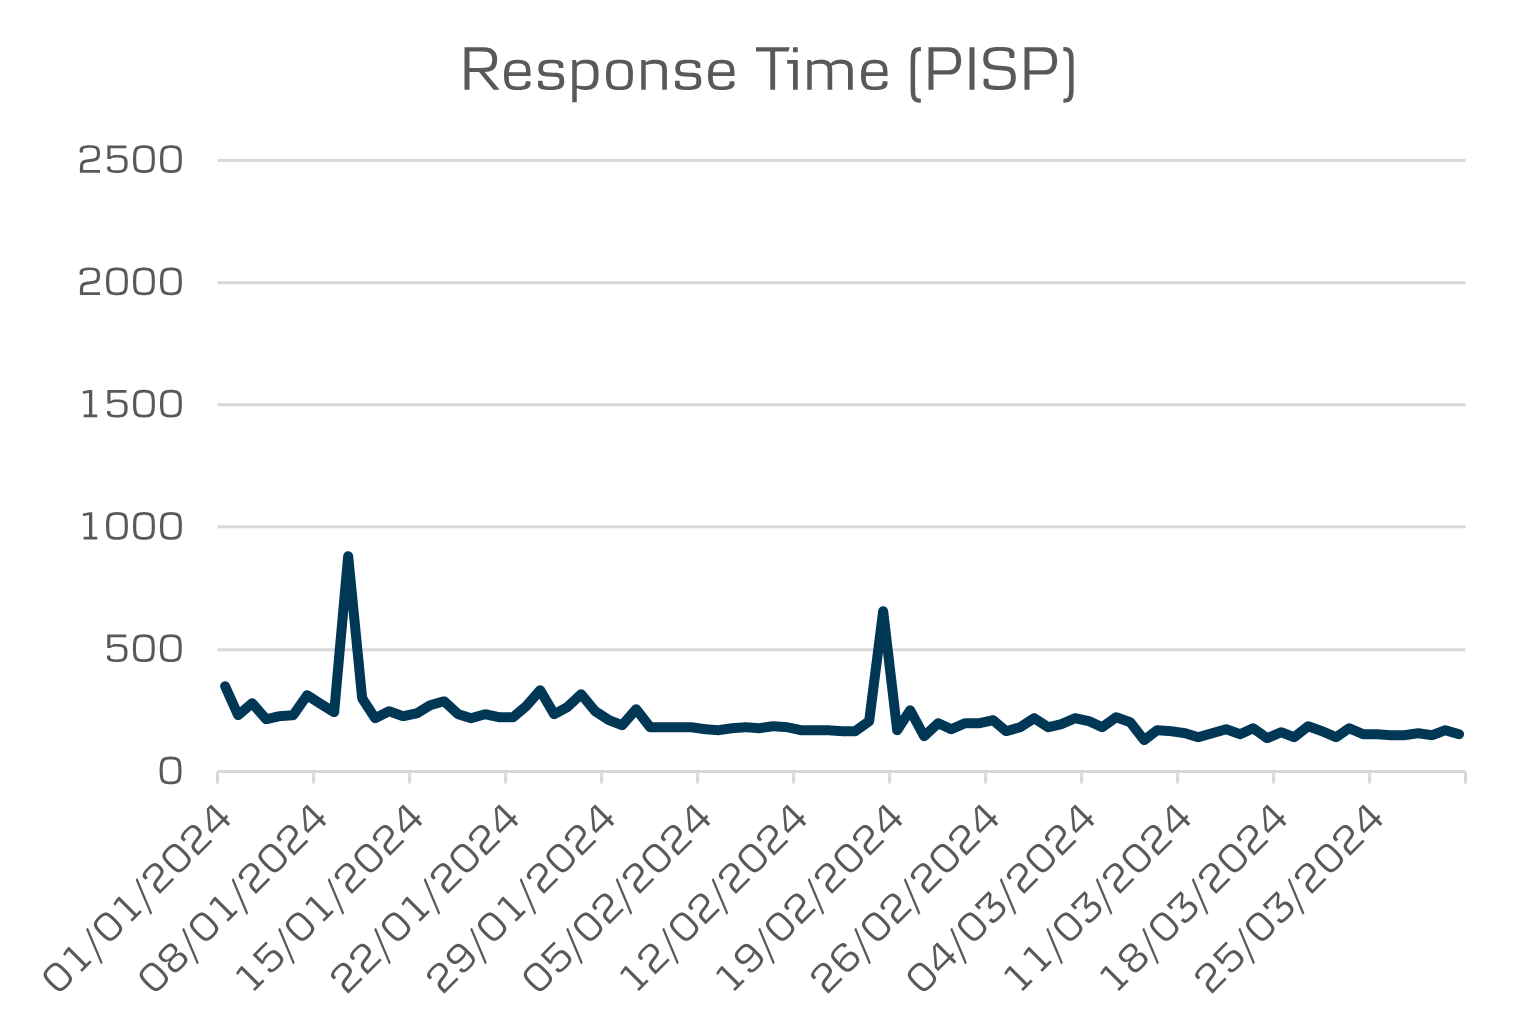
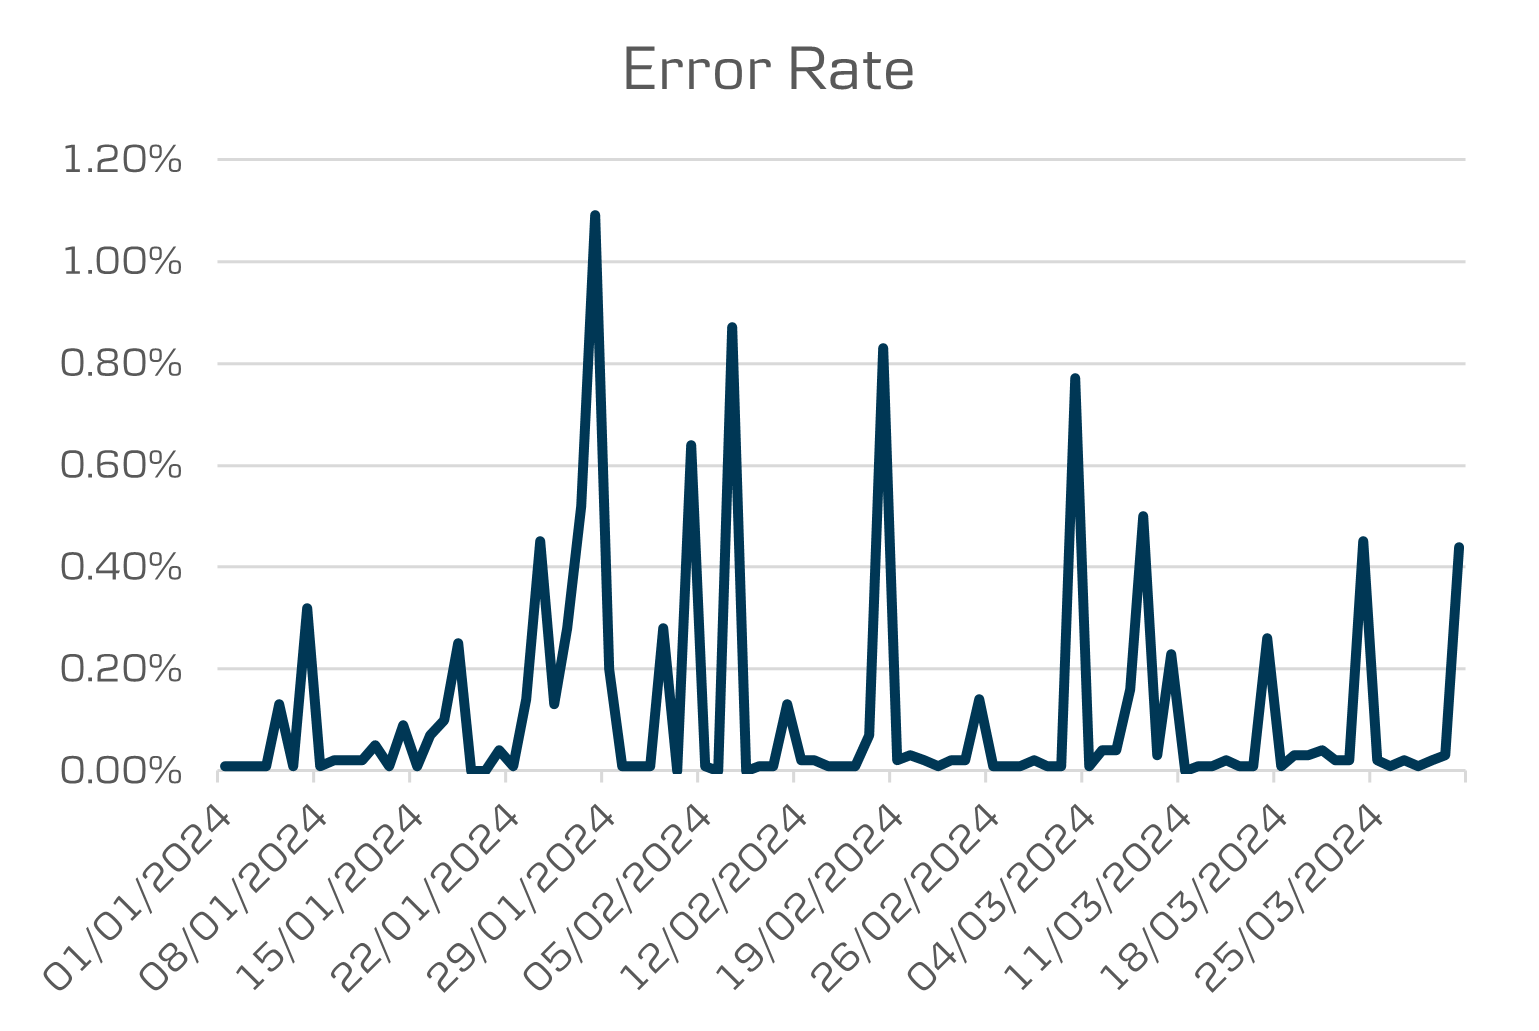
Open Banking Performance
The below charts shows the performance for Open Banking for Quarter 1 2024
Mobile Business & Tablet Performance
The below charts shows the availability for Quarter 1 2024
The below table shows a monthly summary of availability for Quarter 1 2024.
| Month | Uptime | Downtime |
|---|---|---|
| Jan | 100.00 | 0.00 |
| Feb | 100.00 | 0.00 |
| Mar | 100.00 | 0.00 |
| Grand total | 100.00 | 0.00 |
eBanking Performance
The below charts shows the availability for Quarter 1 2024
The below table shows a monthly summary of availability for Quarter 1 2024.
| Month | Uptime | Downtime |
|---|---|---|
| Jan | 99.98 | 0.02 |
| Feb | 100.00 | 0.01 |
| Mar | 100.00 | 0.00 |
| Grand total | 99.99 | 0.01 |
Mobile 3.0 Performance
The below charts shows the availability for Quarter 1 2024
The below table shows a monthly summary of availability for Quarter 1 2024.
| Month | Uptime | Downtime |
|---|---|---|
| Jan | 99.98 | 0.02 |
| Feb | 100.00 | 0.01 |
| Mar | 100.00 | 0.00 |
| Grand total | 99.99 | 0.01 |
District Performance
The below charts shows the availability for Quarter 1 2024
The below table shows a monthly summary of availability for Quarter 1 2024.
| Month | Uptime | Downtime |
|---|---|---|
| Jan | 99.95 | 0.05 |
| Feb | 99.85 | 0.17 |
| Mar | 100.00 | 0.00 |
| Grand total | 99.93 | 0.07 |
Comparison Data – All Channels
Here’s some information to help you understand what the data means
Uptime: The total time in seconds for each day when any element of the customer interface is accessible by the customer in the process of accessing their account. This is calculated as 100% (equal to a 24 hour day) minus the total percentage downtime for each day.
Downtime: The total time in seconds for each day when any element of the customer interface is not accessible by the customer in the process of accessing their account.
PISP response time: The average time taken in milliseconds from when a PSU clicks on a button or link to initiate a payment (i.e. after they have supplied all details and clicked “confirm payment”) to when the PSU receives either a confirmation screen or error message to confirm the status of the payment initiation. This should be the average for all PSU payments initiated each day for each PSU interface. OBIE recommends that the time is reported based on the time taken for the page/screen which contains the confirmation/error message to fully load.
AISP response time: The average time taken in milliseconds from when a logged in (i.e. authenticated) PSU clicks on a button or link to access any PSD2 in-scope payment account information on their account (e.g. list of accounts, balance for an account, page/screen of transactions) to when the page/screen displaying this information has fully loaded. Where this information is displayed immediately and automatically after login, this time should be measured from when the ASPSP has accepted the last factor of the PSU’s authentication (i.e. the load time of the first page/screen after authentication is complete). This should be the average for all pages/screens loaded each day for each PSU interface. OBIE recommends that the time is reported based on the time taken for the page/screen which contains the confirmation/error message to fully load.
Error response rates: the daily error response rate – calculated as the number of error messages concerning errors attributable to the ASPSP sent by the ASPSP to the PISPs, AISPs and CBPIIs in accordance with Article 36(2) of the RTS per day, divided by the number of requests received by the ASPSP from AISPs, PISPs and CBPIIs in the same day.
The charts outlined on this page shows a comparison across Open Banking, eBanking, Mobile Banking & District.
